
Once your survey is live and collecting responses, the Analytics pages help you understand how things are going — from high-level trends across all your surveys down to individual question results.
Global analytics dashboard#
Click Analytics in the sidebar to see a bird's-eye view of all your surveys.
The dashboard includes:
- KPI cards — Total responses, completion rates, and other key numbers at a glance.
- Response timeline — A chart showing responses over time, so you can spot spikes, drops, or trends.
- Device breakdown — See what share of respondents are using desktop, tablet, or mobile.
- Completion funnel — Visualize how many people start your surveys, how far they get, and how many finish. This helps you find drop-off points.
Use this page when you want a quick health check across all your projects.
Per-survey analytics#
Each survey has its own analytics page with more detailed information. You can get there by:
- Clicking the analytics icon on a survey card. The icon is greyed out on a survey that has never been published. Hover over it to see why, and publish the survey to turn it on.
- Opening the survey's Fielding Dashboard and clicking View All Responses.
The survey builder toolbar does not link to response data — use the Fielding Dashboard.
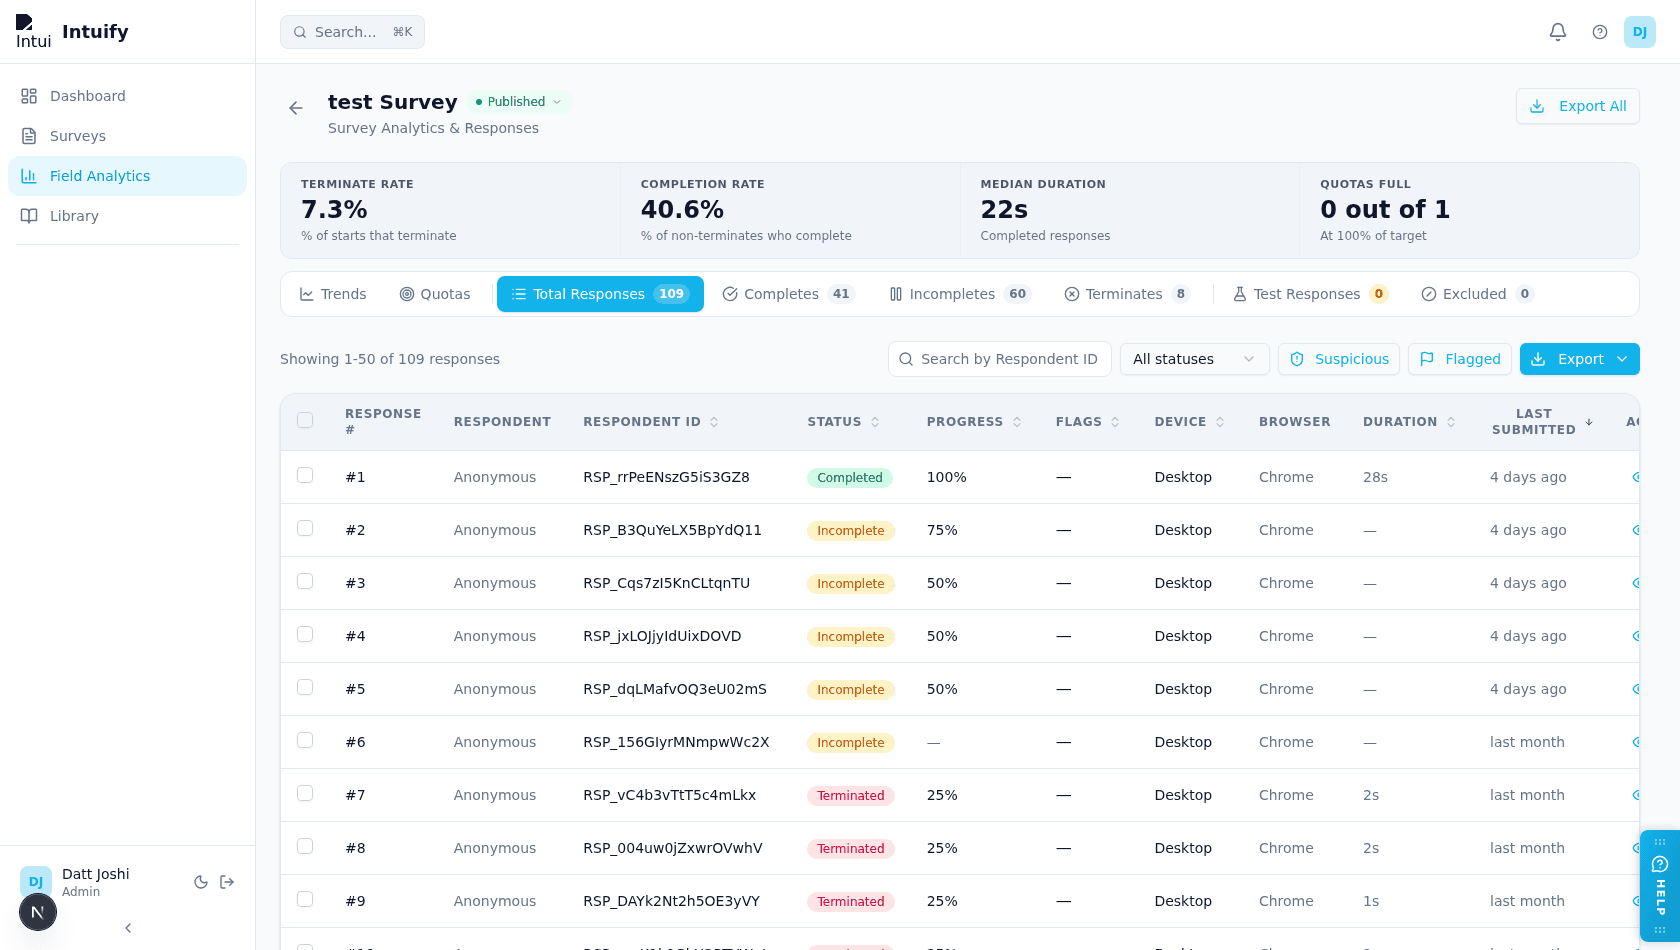
Response views and key metrics#
At the top of the page is a single clickable row of views, each count-bearing view showing its live count (including "(0)"):
- Trends and Quotas.
- Total Responses (the default view), Completes, Incompletes, and Terminates. The last three each open the same responses table pre-filtered to that group, and they always add up exactly to Total Responses. A respondent only counts as a Complete if they finished without being terminated — a quota return is not a complete. You can move a response into Completes yourself; see Marking a response complete.
- Test Responses and Excluded — plus a Files view when the survey has respondent file uploads.
- Survey Test Runs, next to Test Responses, once you have used Run Survey Test or AI simulation on the survey. It lists every response those runs recorded — the test run and scenario each came from, and its status — and View opens the answers the run gave. These responses are kept apart from real and test-link responses, so they never count toward analytics, quotas or exports.
Below the row is a read-only strip of derived metrics:
- Terminate Rate — the share of starts that were terminated (Terminates ÷ Total Responses).
- Completion Rate — the share of non-terminated respondents who completed (Completes ÷ (Completes + Incompletes)).
- Median Duration — the typical time respondents spend.
- Quotas Full — shown as "X out of Y" across every quota with a limit; "—" when the survey has no quotas.
A metric shows "—" instead of a number when there is no data yet (for example, on a survey with no responses).
Responses table#
The Total Responses, Completes, Incompletes, and Terminates views all show a table listing every individual response in that group, showing:
- Start and end times.
- Duration.
- Status (complete, incomplete, or terminated).
- Respondent email — If the response was tied to an email (via a sign-in survey, an email distribution, or a
?email=link parameter), it appears in its own column so you can scan who submitted what at a glance. - Panel — On a survey with a panel provider linked, the Respondent column is replaced by a Panel column reading
<panel>: <panelist id>(for exampleProdege: 08274592). Respondents who did not come through a panel — such as a client's own email list fielded alongside the panel — show a blank Panel cell.
You can sort and filter this table to find specific responses. Sorting and filtering apply to the whole survey, not just the page on screen, and the "Showing X–Y of N responses" count reflects the filtered total.
Filtering and sorting by panel#
When a survey is fielded through a panel and another source at the same time, you can isolate either group:
- Panel filter — A Panel dropdown sits next to All statuses in the toolbar, on Total Responses, Completes, Incompletes and Terminates. It lists every panel your responses came in under, plus No panel for respondents who did not come through one. Pick a panel to see only its respondents; pick All panels to clear it. It combines with the status filter, the Suspicious / Flagged toggles and the Respondent ID search.
- Sortable Panel column — Click the Panel column header to group respondents by panel, A to Z, with respondents who have no panel at the bottom; click again for Z to A, which brings the respondents with no panel to the top.
The chosen panel and sort are kept in the page address, so a refresh keeps your view and you can share the link. Export from the toolbar downloads only the panel you have filtered to.
The Panel dropdown and sortable header only appear on surveys with a panel provider linked.
Response detail modal#
Click the View action on any response to open the Response Detail modal. It shows the respondent's answers question by question, with most of the window given to the answers.
A single line at the top shows the Status, Duration and Device, plus the flag reason when there is one. Click Show details to open the full metadata panel with everything Intuify captured about that response (it starts closed each time you open a response):
- Respondent email (when available).
- Start time, end time, and duration.
- Status (complete, incomplete, terminated, or flagged).
- Flag reason — If the response was auto-flagged for quality reasons (speeder, straight-liner, bot detection, etc.), the specific reason is shown here so you can triage quickly.
- IP address — Helpful for deduplication or fraud checks.
- Operating system and device — e.g. "macOS 14 — Desktop", "iOS 17 — Mobile".
- Language — The language the respondent actually took the survey in (handy for multi-language surveys).
- Panel / source — Which distribution channel or panel provider the respondent came from, when available.
When the survey declares global variables, a Global Variables section below the answers lists each one with the value recorded for this respondent, or a dash when none was recorded.
Answer options the respondent never saw are greyed out. An option can be hidden by randomization (for example "show 3 of 6 choices"), by display logic on the option, or by carry-forward. Hover over a greyed-out option to see Not displayed to this respondent. This lets you tell an option the respondent saw and left unselected from one they were never shown. It applies to Single Choice, Multiple Choice, Distribution and Constant Sum options and to Matrix rows and columns. Responses collected before Intuify started recording which options were shown are not marked.
A Navigation Tree answer shows the chosen path with a Correct or Incorrect label. Click the i beside it for a short example of how the answer is stored in the export: one line with four parts (time spent, selected path, click history, is correct).
A Simplified Shelf Choice answer lists the products the respondent bought with their quantity ("Bought nothing" after Buy None), the other products on their shelf as "0 (not bought)", and a closed Not shown (N) list of the products that were not on their shelf. See Simplified Shelf Choice → Reading the answers. A Pick, Group & Rank answer shows a table with one row per item: the item, the group the respondent put it in, and its rank in that group when ranking is on. Items the respondent did not place show a dash.
Use the detail modal when a single response needs investigation (quality review, follow-up, or data-request handling) and the table row alone isn't enough.
Export Response downloads this one response as the same row it has in the Export Data file (a CSV with both header rows). On a survey with a Shelf Choice or Online Choice question it downloads an Excel file instead, with that row on one sheet and a row per product the respondent was shown on another.
On those responses each Shelf Choice or Online Choice question carries an i beside its question text. Click it for a legend of the pipe-delimited entries that question puts in the file: the field order, that each entry is one product shown, that the attribute fields count from 0, that a Buy None screen keeps its entries with the purchase fields at 0, and which sheet of the workbook shows the same data with readable labels. Each icon explains only its own question, so a response with both question types shows two. No other question type has one.
Marking a response complete#
A response sometimes deserves to count as a complete even though the survey never recorded it as one. Someone answers every question and closes the tab before the final submit, or a screen-out rule fires on a question you have since decided was too strict. Mark as complete promotes that response so it counts like any other complete.
You need permission to edit the survey. Being able to view Field Management is not enough on its own, because this changes data rather than just showing it.
Where to do it
- One row at a time in the responses table. On desktop it is the green tick next to View; on the mobile card list it reads Complete.
- Several at once. Tick the rows you want and click Mark complete in the selection bar.
- From the Response Detail modal, using the Mark as complete button at the bottom.
All three ask you to confirm first. The single-response confirmations name what ended the response and say whether promoting it will count toward your quotas; the bulk confirmation says the same for the selection as a whole.
Keeping quotas within their limits. On a survey that has quotas, the confirmation also offers a tick box: Keep quotas within their limits. Leave it unticked — the default — and the promotion goes ahead even if it carries a quota past its cap, which is usually what you want, because promoting is you overriding the quota on purpose. Tick it and Intuify refuses any promotion that would push a quota over: a single response tells you which quota stopped it and stays as it was, and a bulk selection promotes everything that fits and reports how many it held back. The box only appears where it can change something — a survey with no quotas never shows it, and neither does a response that was already counted.
What can be promoted
| Status | Can you mark it complete? |
|---|---|
| Incomplete | Yes. The answers collected so far are kept, and the response joins your completes. |
| Terminated | Yes, whatever ended it: a screen-out, a quota return, or a quality-control rule. |
| complete | No. The action isn't offered on the row, and a bulk selection containing completes skips them and tells you how many it skipped — the confirmation counts only the responses that will actually move. If every response you selected is already complete, Intuify says so instead of asking you to confirm an action that would do nothing. |
What promoting changes
- The response leaves Incompletes or Terminates and appears under Completes. Terminate Rate and Completion Rate move with it.
- A promoted terminate also drops out of the Termination report, so the rule or end screen that stopped it no longer counts it.
- It syncs downstream as a completed record, exactly as an organic complete does. That is true of every promotion, the quota-return case below included.
- Whether it counts toward a quota depends on whether the respondent had already reached the end of the survey — not on what stopped them. (Unless you tick Keep quotas within their limits, in which case a promotion that would take a quota over its cap is refused instead.) Almost everything you can promote never got that far: a partial, a screen-out, a quality-control removal, and a quota return that turned someone away part-way through. None of those was ever counted, so promoting one counts it now, exactly as an organic complete would be. The single exception is a respondent who answered their way to the end and was only then handed back by a full quota: that quota counted them at the moment it returned them, and promoting them does not count them a second time.
- The response keeps a Marked complete stamp in its detail modal, and a promoted terminate additionally shows Promoted from Screenout / Quota Return / Quality Control, so nobody later mistakes it for a respondent who finished the questionnaire. Your exports carry the same information in the Promoted From column, so a promoted respondent stays identifiable in a delivery file.
Promoting cannot be undone. There is no "unmark complete", so treat it as a final decision.
A screen-out may have no answers left to promote. When the survey's Capture screen-out responses setting is off (Settings → Response controls), Intuify records the screen-out but discards the respondent's answers. Promoting one of those gives you a complete with no answer data in it, which reads as an empty row in a delivery file. The confirmation warns you before you commit, and the bulk confirmation says how many of the selected responses are affected.
Question analysis#
Further down, each question gets its own results widget tailored to its type:
- Single / Multiple choice — Counts and percentages for each option.
- NPS — Your NPS score plus the promoter, passive, and detractor breakdown.
- Rating and Slider — Averages and distributions.
- Matrix — Summaries by row and column.
- Distribution — Average allocation per option.
Quotas#
Quotas let you control how many respondents with specific characteristics can complete your survey. This is essential for balanced research.
Tracking quotas#
Tracking quotas count how many respondents in a particular segment have completed the survey. For example, you might track how many respondents aged 18–24 in the US have finished.
- Quotas only increment when a respondent actually completes the survey, or when you mark a response complete yourself.
- Use tracking quotas to monitor progress toward your target sample sizes in real time.
Terminate quotas#
Terminate quotas stop respondents from continuing once a segment is full. For example, once you have 200 completed responses from women aged 25–34, new respondents matching that profile are redirected out of the survey.
- You can redirect terminated respondents to a specific URL (for example, a panel provider's redirect link).
- Terminate quotas are checked as respondents progress through the survey.
Managing quotas#
- Configure quotas in the builder under Logic → Quotas (groups, limits, terminate/redirect actions, variable-based conditions).
- Each quota group can be marked Public for a shareable dashboard URL (
/q/{surveyId}/{groupId}). - The per-survey Analytics page includes a Quotas tab with live fill levels (auto-refreshes while open).
Termination report#
Not everyone who starts a survey finishes it — some are screened out, some hit a terminating end screen, and some arrive after a quota is already full. The Termination report gathers all of those exits into one place so you can see exactly where respondents were terminated and how many at each point.
Where terminations come from#
Every termination point is labelled with the source that stopped the respondent, so a single report can mix all three without ambiguity:
- Termination Rule — A per-question termination rule from the Logic tab (for example, a screenout or a quality-control check).
- End of Survey — A terminating End-of-Survey block reached through the survey flow.
- Quota Full — A respondent redirected out because a quota was already filled.
Each row shows the termination point's name, its source badge, and the number of respondents that ended there. Rows are sorted by count (highest first), so the biggest drop-off points rise to the top.
A response you mark as complete is no longer a termination, so it stops counting against the point that stopped it and its row's number falls by one.
Opening the report#
The same report is reachable from two places, and both show an identical breakdown:
- Fielding Dashboard — On the per-survey Analytics page, open the Terminates view. It lists the terminated responses themselves, with a collapsed Termination rule report panel above the list. Expand the panel to see your termination points; the Termination Reports button in its top-right opens the full report.
- Flow editor — Select an End-of-Survey block in the Flow tab and choose Termination Reports. This opens the same report, covering all three sources (not just end screens).
Route: /surveys/{surveyId}/analytics?tab=terminates — the terminated-responses list with the rule report panel above it.
Use the termination report when you want to understand why people are leaving — whether a screenout is firing more than expected, which end screen is catching the most respondents, or how much of your traffic a full quota is turning away.
Quality and flagged responses#
Intuify can flag responses automatically for:
- Speeding — Completed faster than a configurable threshold.
- Straightlining — Too little variation in matrix-style answers.
- Duplicate IP — Multiple submissions from the same address.
- Custom rules — Your own AND/OR conditions on duration, metadata, or answers.
Flagged responses show a flag reason in the response detail modal. Use flag/unflag actions when reviewing data before export.
Excluding, including, and purging#
Excluding a response does not destroy it. It leaves your analytics, quota counts and exports, and moves to the Excluded tab on the survey analytics page, where you can:
- Include response — Bring a response back into active analytics and quotas.
- Delete forever — Permanently remove the response. This one cannot be undone.
This supports review workflows without immediately losing data.
Exporting your data#
You can export response data in several formats:
- CSV
- Excel
- JSON
Exports include respondent answers, metadata (timestamps, duration, device), and tracking fields. Choose text or numeric (recode) values for choice questions in export options.
Export All (top right of the Fielding dashboard) and Export Data… (Responses tab) write the same answers. A Shelf Choice or Online Choice question is one column of pipe-delimited entries, one per product shown, in both.
SPSS (.sav) export is on the roadmap. Today use CSV or Excel with variable names and recode values for statistical tools.
Recode values#
For choice-based questions, each answer option has a numeric recode value that appears in your export. You can customize these values in the builder by opening the Recode Values dialog for a question. This is useful when your analysis tools expect specific numeric codes.
Variable names#
Each question can have a custom variable name (for example, Q1, NPS_Score, Usage_Freq). When set, this name is used as the column header in your export, making it easier to work with the data in statistical tools.
Standard tracking fields#
Intuify automatically records useful metadata for every response:
- Start time — When the respondent began the survey.
- End time — When they finished (or dropped off).
- Duration — How long they spent.
- IP address — Recorded by default (you can turn this off in survey settings).
- Email — When distributed via email or panel lists.
- Page-level timestamps — For more detailed timing analysis.
These fields are included in your exports and can be used for filtering and quality checks.
Removing responses#
To remove a response (test run, duplicate, or data request):
- Exclude it from the responses table — the response moves to the Excluded tab and stops counting towards analytics, quotas and exports.
- Include it again from the Excluded tab if you excluded it by mistake.
- Delete forever from the Excluded tab to permanently remove it.
Only Delete forever destroys data. Excluding and including update analytics and adjust quota counts, and either can be reversed. (On the Test Responses tab the same permanent action is offered in bulk as Purge all.)
Responses on the Survey Test Runs tab are not excluded — they never counted in the first place. Delete removes one from the list, and Delete all permanently removes every response the test runs recorded for the survey.
Was this page helpful?